As many developers probably know, it's possible to navigate to the GAC by using the command line to go to C:\Windows\Assembly (this is on Windows Server 2003).
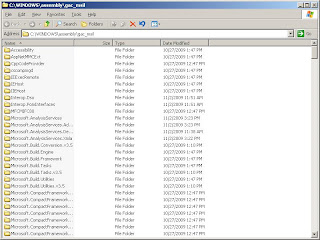
However, it's also possible to get Explorer to show items in the GAC. All of the assemblies I have created with Visual Studio end up in the GAC_MSIL folder. I can take the following steps to view them: click Start / Run, then key in "%SYSTEMROOT%\assembly\gac_msil", and click OK.
An Explorer window will pop up showing all of the assemblies in that part of the GAC:

Why would you want to do this? This trick allows you to debug a DLL directly from the GAC. You can now navigate to the exact location of the DLL, and then drop the .PDB in the same folder. If you then have the project for the DLL open in Visual Studio, you can attach to the process calling your DLL and set breakpoints, etc.
This doesn't always work smoothly, but there are some situations where it was the only way to get the job done. In particular, if the client for the DLL is a program like BizTalk or SharePoint, it's the only way I could debug the DLL.
I have encountered at least one time when I had to reboot to be able to set breakpoints, but it beat the hell out of my alternatives.
Remember to remove the PDB from the GAC before you try to UN-install your DLL.
No comments:
Post a Comment